☰

Mach 2 laminar flat plate (LTS)
Attached shock wave | Laminar flow | Local Time Stepping
![]() Working directory located here
Working directory located here
![]() J.-J. O.E. Hoste and V. Casseau, "Verification and Validation of hyFoam for Supersonic External Flows," TechReport-HS1, 05/2021 [PDF→]
J.-J. O.E. Hoste and V. Casseau, "Verification and Validation of hyFoam for Supersonic External Flows," TechReport-HS1, 05/2021 [PDF→]
1. CASE SETUP
1.1 Mesh
View of the structured mesh created using blockMesh

It is composed of 128,136 hexahedra and has a geometric progression ratio of 2 in both directions.
1.2 Case conditions
The 0.1-meter plate is maintained at a temperature of 600 K.
The freestream conditions are given in
- Ma∞ = 2
- Re∞ = 500
- p∞ = 114.46 Pa
- T∞ = 300 K
- U∞ = (694.55 0 0) m/s
- YN2, ∞ = 0.76708
- YO2, ∞ = 0.23292
1.3 Thermo-chemical and transport models
This test case is using the following thermo-chemical and transport models:
- no vibrational nor electronic energy (calorically perfect gas)
- no chemical reactions
- thermal equilibrium
- species viscosity: Blottner
- species thermal conductivity: Eucken
- no species diffusion
- laminar flow
1.4 Time controls
The initial time-step is set to 1 x 10⁻⁹ s and the maximum CFL number is 0.5. The simulation end time is equal to 5 x 10⁻⁵ s. Local time stepping is used.
2. RUNNING
The following commands will execute blockMesh, checkMesh and hyFoam in serial
./Allclean
./Allrun
To run hyFoam in parallel (say on 8 CPUs), please first edit the
./Allclean
./Allrun 8
3. MONITORING
gnuplot gnuplot/monitorResiduals

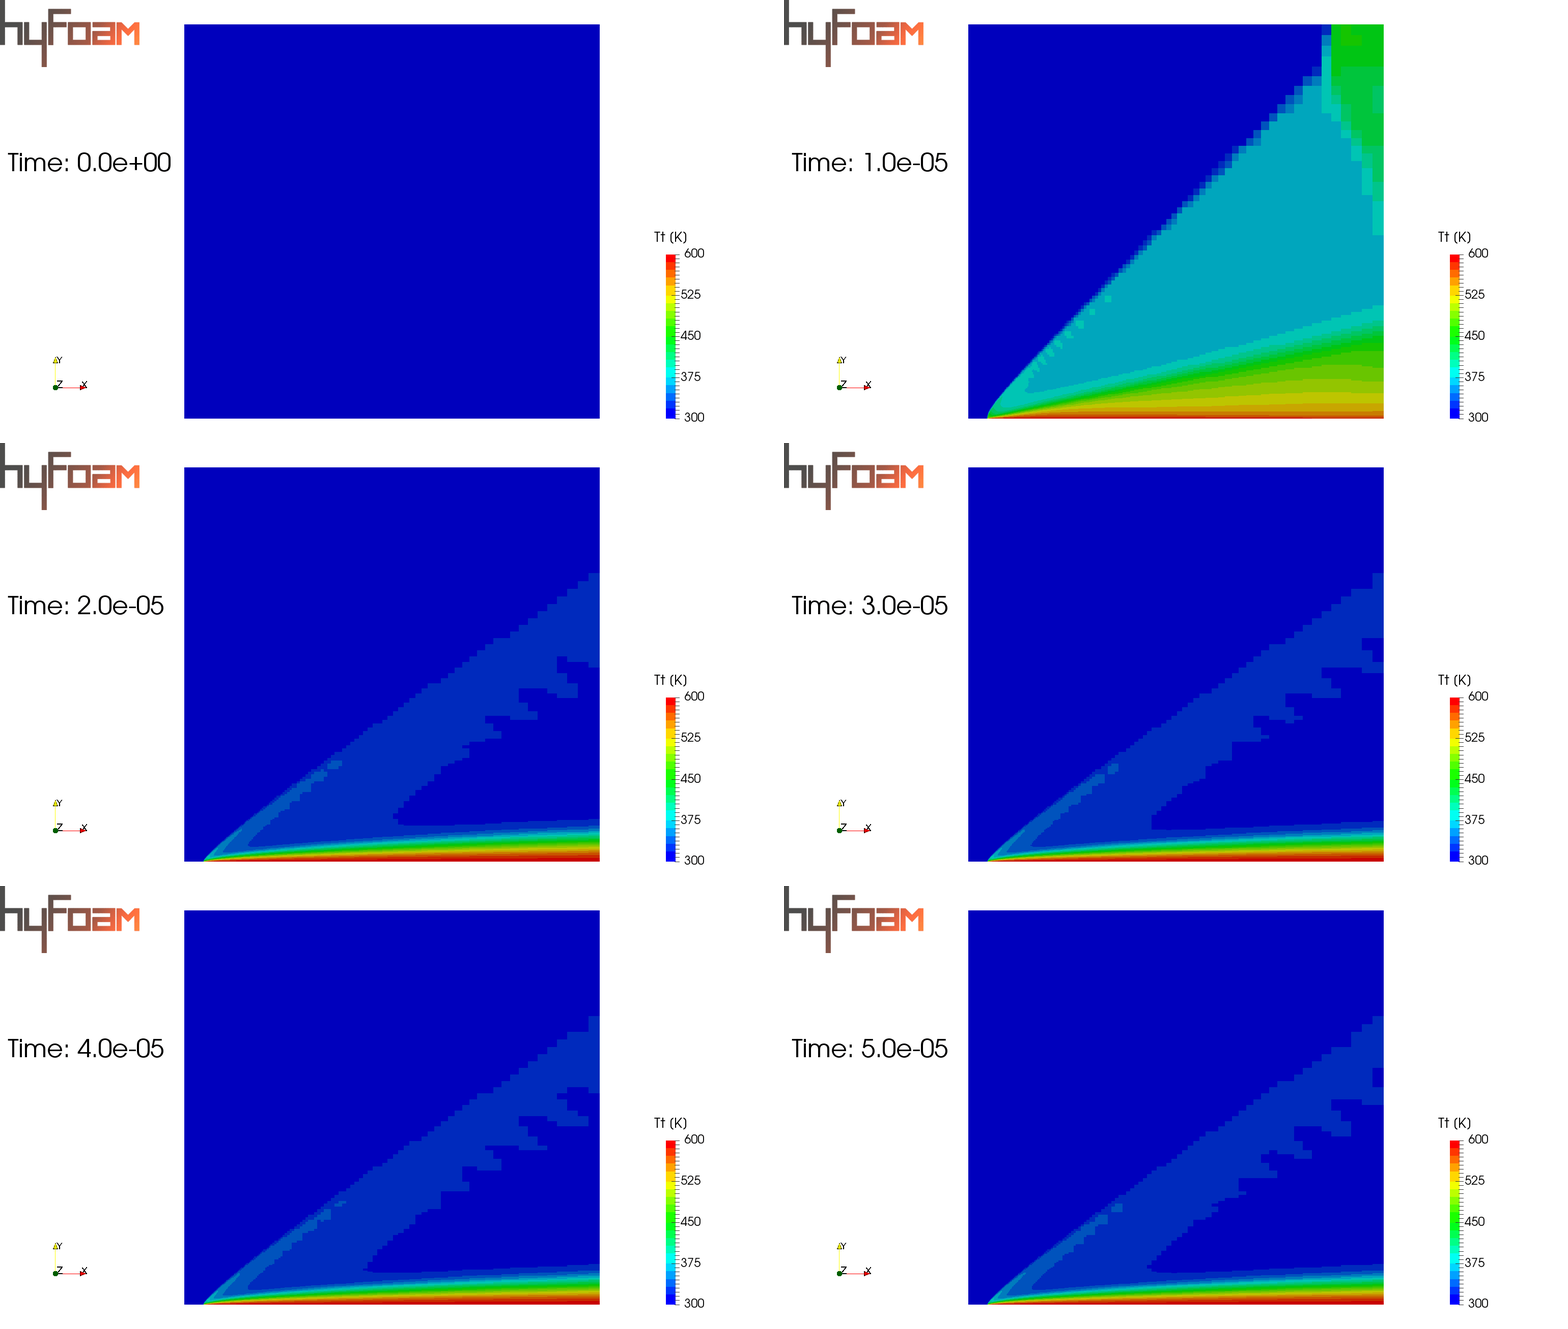
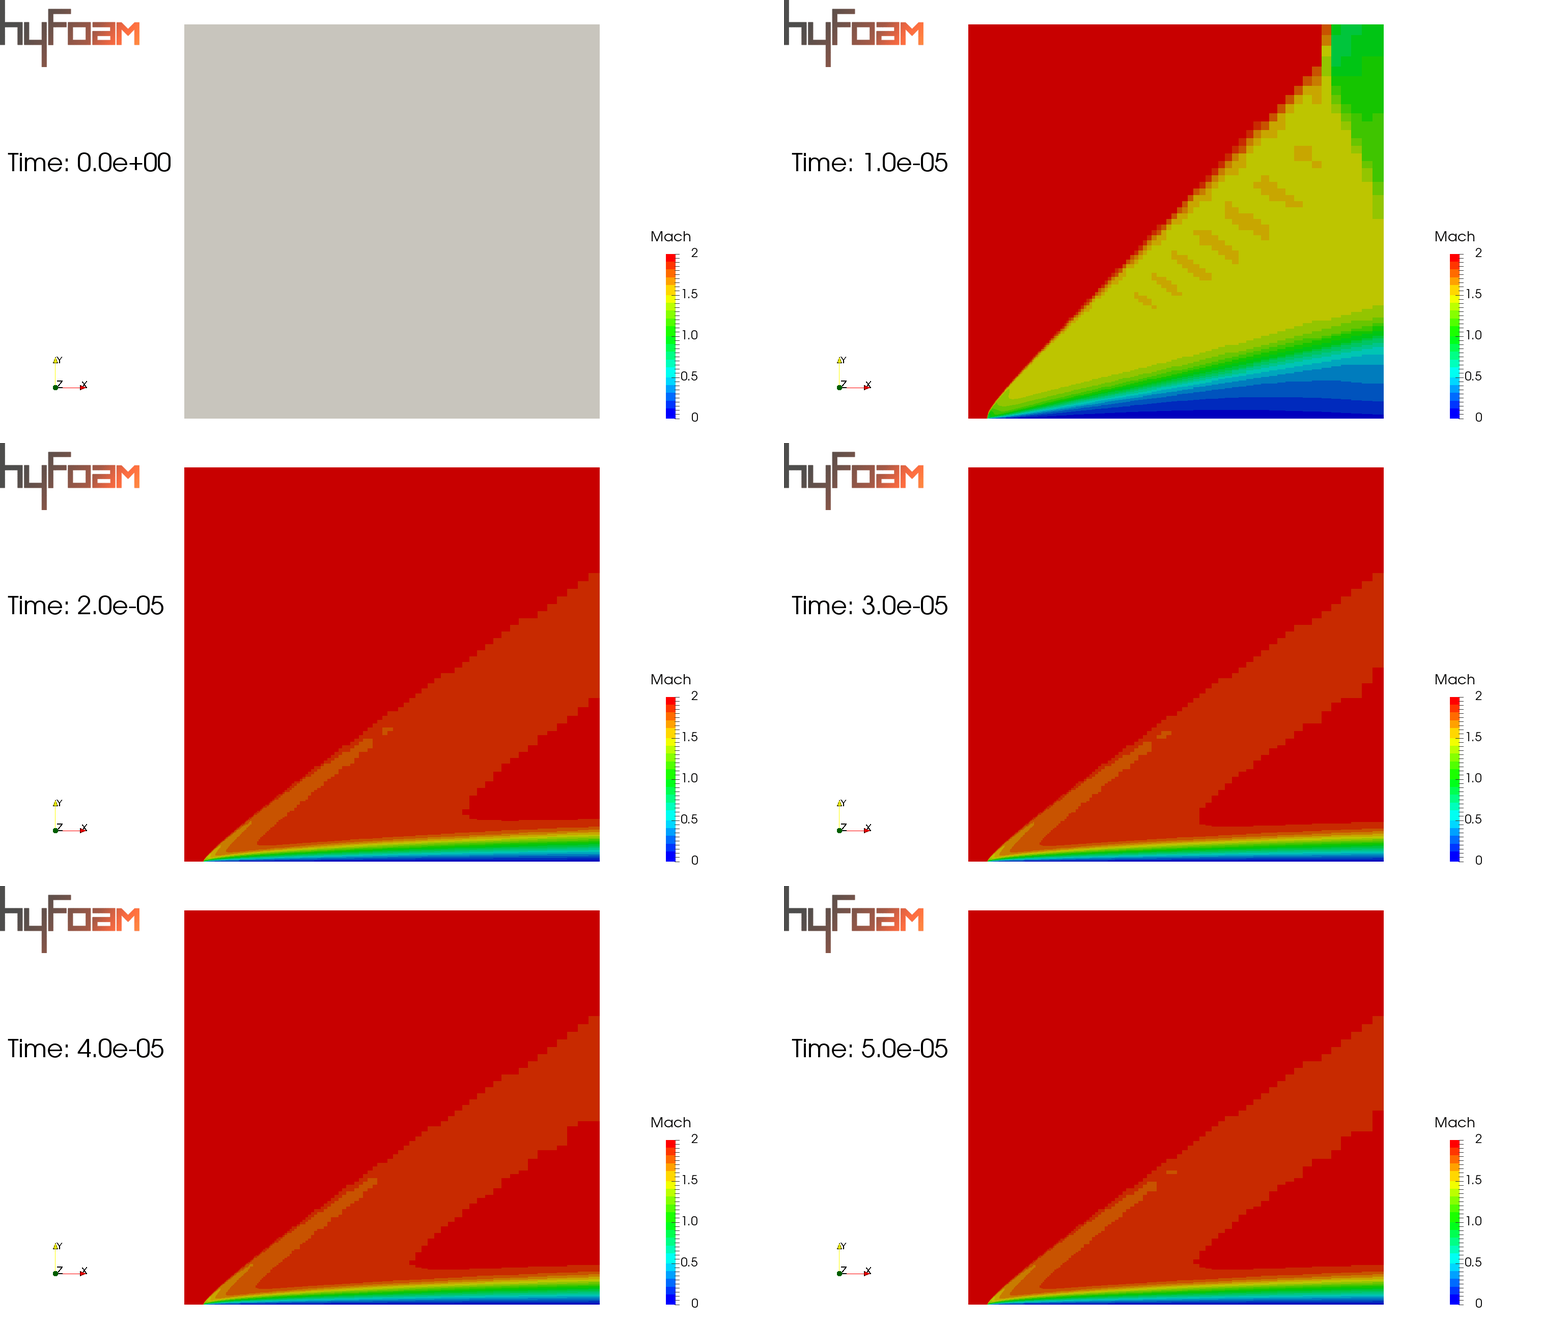
4. FLOW VISUALISATIONS IN PARAVIEW
5. POST-PROCESSING
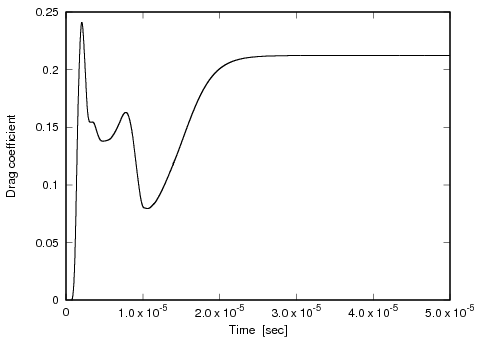
gnuplot gnuplot/monitorCd
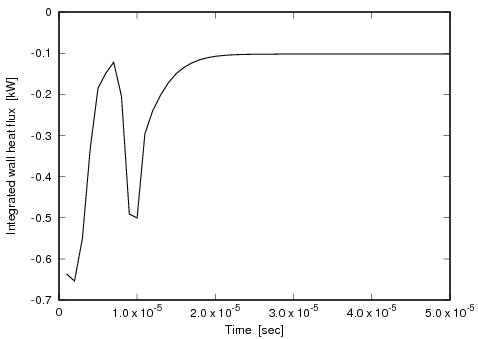
gnuplot gnuplot/monitorIntegratedWallHeatFlux
6. SOLUTION
Sampling temperature, pressure, and velocity along a line normal to the plate and located at x = 0.01 m away from the leading edge (h is the boundary layer height, set to 4 mm)

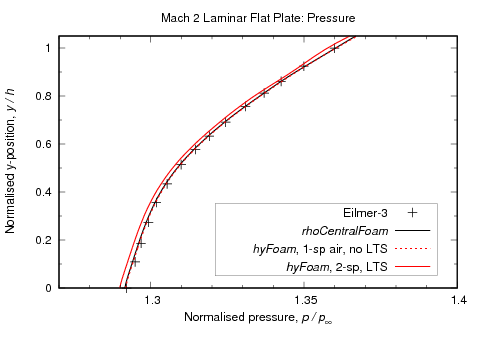
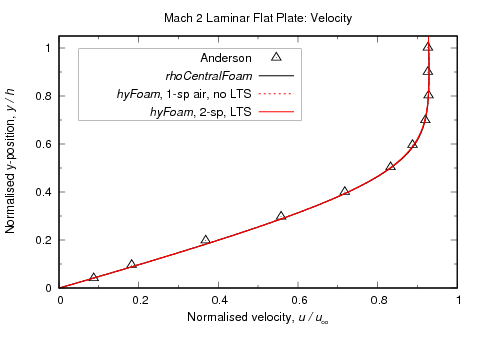
The small shift in normalised pressure is the result of having 2 distinct species (N2 and O2) as opposed to modelling air as being a single species.
7. REGRESSION TESTING
Check that the results are matching the solution stored in
./Alltest
Contributors: Dr Jimmy-John O.E. Hoste, Dr Daniel E.R. Espinoza, Dr Vincent Casseau